Advanced Recipes
Like other tools in Plots, recipes are relatively simple, but extremely powerful. A recipe is created by invoking the @recipe macro, which is defined in the lightweight package RecipesBase. There are many examples of recipes both within Plots and in many external packages, including PlotRecipes.
There are three main types of recipes in Plots:
- User Recipes
- Type Recipes
- Series Recipes
I'll discuss all three in detail later. First, lets decompose what's happening inside the recipe macro. Lets start with a simple recipe:
type MyType end

@recipe function f(::MyType, n::Integer = 10; add_marker = false)
    linecolor   --> :blue
    seriestype  :=  :path
    markershape --> (add_marker ? :ellipse : :none)
    delete!(d, :add_marker)
    rand(n)
end
We create a new type MyType, which is empty, and used purely for dispatch. Our goal here is to create a random path of n points.
There are a few important things to know, after which recipes boil down to updating an attribute dictionary and returning input data:
- A recipe signature
f(args...; kw...)is converted into a definition ofapply_recipe(d::KW, args...)where:dis an attribute dictionary of typetypealias KW Dict{Symbol,Any}- Your
argsmust be distinct enough that dispatch will call your definition (and without masking an existing definition). Using a custom data type will ensure proper dispatch. - The function
fis unused/meaningless... call it whatever you want. - Keyword arguments
kwhave special treatment. They are added to the attribute dictionarydand assigned to a local variable of the same name.- Note that you will need to
pop!(d, k)ordelete!(d, k)to clean up the attributes when you're done. (this requirement will probably be removed eventually)
- Note that you will need to
- The special operator
-->turnslinecolor --> :blueintoget!(d, :linecolor, :blue), setting the attribute only when it doesn't already exist. (Tip: Wrap the right hand side in parentheses for complex expressions.) - The special operator
:=turnsseriestype := :pathintod[:seriestype] = :path, forcing that attribute value. (Tip: Wrap the right hand side in parentheses for complex expressions.) - The return value of the recipe is the
argsof aRecipeDataobject, which also has a reference to the attribute dictionary. - A recipe returns a Vector{RecipeData}. We'll see how to add to this list later with the
@seriesmacro.
Breaking down the example:
In the example above, we use MyType for dispatch, with optional positional argument n::Integer:
@recipe function f(::MyType, n::Integer = 10; add_marker = false)
With a call to plot(MyType()) or similar, this recipe will be invoked. If linecolor has not been set, it is set to :blue:
linecolor --> :blue
The seriestype is forced to be :path:
seriestype := :path
The markershape is a little more complex; it checks the add_marker custom keyword, but only if markershape was not already set. (Note: the add_marker key is redundant, as the user can just set the marker shape directly... I use it only for demonstration):
markershape --> (add_marker ? :ellipse : :none)
We remove the add_marker key from our attribute dictionary:
delete!(d, :add_marker)
then return the data to be plotted:
    rand(n)
end
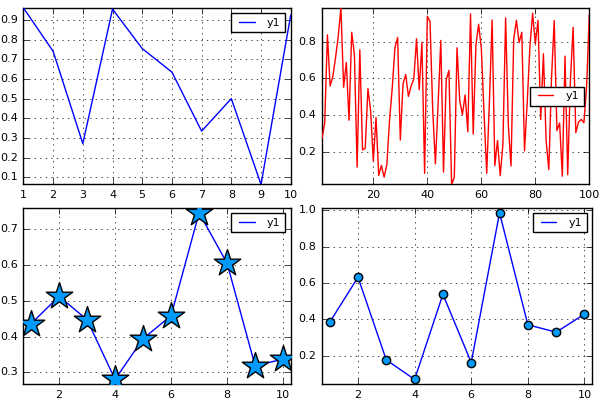
Some example usages of our (mostly useless) recipe:
mt = MyType()
plot(
    plot(mt),
    plot(mt, 100, linecolor = :red),
    plot(mt, marker = (:star,20), add_marker = false),
    plot(mt, add_marker = true)
)
User Recipes
The example above is an example of a "user recipe", in which you define the full signature for dispatch. User recipes (like others) can be stacked and modular. The following is valid:
@recipe f(mt::MyType, n::Integer = 10) = (mt, rand(n))
@recipe f(mt::MyType, v::AbstractVector) = hist(v)
Here a call to plot(MyType()) will apply these recipes in order; first mapping mt to (mt, rand(10)) and then subsequently mapping to hist(rand(10)).
Type Recipes
For some custom data types, they are essentially light wrappers around built-in containers. For example you may have a type:
type MyWrapper
    v::Vector
end
In this case, you'd like your MyWrapper objects to be treated just like Vectors, but do not wish to subtype AbstractArray. No worries! Just define a type recipe to do the conversion:
@recipe f(::Type{MyWrapper}, mw::MyWrapper) = mw.v
This signature is called on each input when dispatch did not find a suitable recipe for the full args.... So plot(rand(10), MyWrapper(rand(10))) will "just work".
Series Recipes
This is where the magic happens. You can create your own custom visualizations for arbitrary data. Quickly define violin plots, error bars, and even standard types like histograms and step plots. A histogram is a bar plot:
@recipe function f(::Type{Val{:histogram}}, x, y, z)
    edges, counts = my_hist(y, d[:bins],
                               normed = d[:normalize],
                               weights = d[:weights])
    x := edges
    y := counts
    seriestype := :bar
    ()
end
while a 2D histogram is really a heatmap:
@recipe function f(::Type{Val{:histogram2d}}, x, y, z)
    xedges, yedges, counts = my_hist_2d(x, y, d[:bins],
                                              normed = d[:normalize],
                                              weights = d[:weights])
    x := centers(xedges)
    y := centers(yedges)
    z := Surface(counts)
    seriestype := :heatmap
    ()
end
See below where I go through a series recipe for creating boxplots. Many of these "standard" recipes are defined in Plots, though they can be defined anywhere without requiring the package to be dependent on Plots.
Case studies
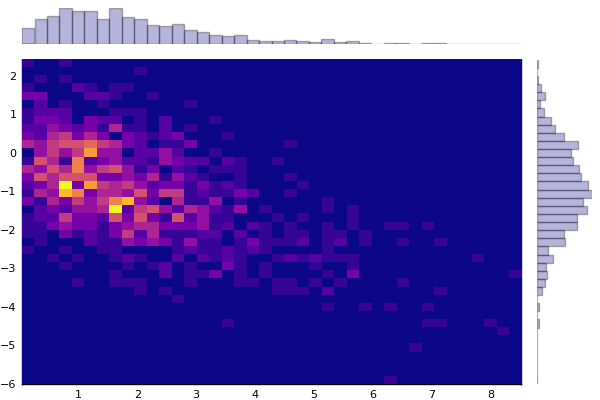
Marginal Histograms
In this case study, I'll explain how I built the marginalhist recipe for PlotRecipes. This is a nice example because, although easy to understand, it utilizes some great Plots features.
Marginal histograms are a visualization comparing two variables. The main plot is a 2D histogram, where each rectangle is a (possibly normalized and weighted) count of data points in that bucket. Above the main plot is a smaller histogram of the first variable, and to the right of the main plot is a histogram of the second variable. The full recipe:
@userplot MarginalHist

@recipe function f(h::MarginalHist)
    if length(h.args) != 2 || !(typeof(h.args[1]) <: AbstractVector) || !(typeof(h.args[2]) <: AbstractVector)
        error("Marginal Histograms should be given two vectors.  Got: $(typeof(h.args))")
    end
    x, y = h.args

    # set up the subplots
    legend := false
    link := :both
    ticks := [nothing :auto nothing]
    grid := false
    foreground_color_subplot := [RGBA(0,0,0,0) :match RGBA(0,0,0,0)]
    layout := @layout [tophist           _
                       hist2d{0.9w,0.9h} righthist]

    # main histogram2d
    @series begin
        seriestype := :histogram2d
        subplot := 2
        x, y
    end

    # these are common to both marginal histograms... borrow the first color from the fill gradient
    fillcolor := getColor(colorscheme(get(d, :fillcolor, Plots.default_gradient())))
    fillalpha := 0.3
    linealpha := 0.3
    seriestype := :histogram

    # upper histogram
    @series begin
        subplot := 1
        x
    end

    # right histogram
    @series begin
        orientation := :h
        subplot := 3
        y
    end
end
Usage:
using Distributions, PlotRecipes
pyplot()
n = 1000
x = rand(Gamma(2), n)
y = -0.5x + randn(n)
marginalhist(x, y, fc=:plasma, bins=40)
Now I'll go through each section in detail:
The @userplot macro is a nice convenience for creating a new wrapper for input arguments that can be distinct during dispatch. It also creates lowercase convenience methods (marginalhist and marginalhist!) and exports them.
@userplot MarginalHist
We dispatch only on the generated type, as the real inputs are wrapped inside it:
@recipe function f(h::MarginalHist)
Some error checking. Note that we're extracting the real inputs (like in a call to marginalhist(randn(100), randn(100))) into x and y:
    if length(h.args) != 2 || !(typeof(h.args[1]) <: AbstractVector) || !(typeof(h.args[2]) <: AbstractVector)
        error("Marginal Histograms should be given two vectors.  Got: $(typeof(h.args))")
    end
    x, y = h.args
Next we build the subplot layout and define some attributes. A few things to note:
- The layout creates three subplots (`_` is left blank)
- Attributes are mapped to each subplot when passed in as a matrix (row-vector)
- The attribute `link := :both` means that the y-axes of each row (and x-axes of
    each column) will share data extrema.  Other values include `:x`, `:y`,
    `:all`, and `:none`.
    # set up the subplots
    legend := false
    link := :both
    ticks := [nothing :auto nothing]
    grid := false
    foreground_color_subplot := [RGBA(0,0,0,0) :match RGBA(0,0,0,0)]
    layout := @layout [tophist           _
                       hist2d{0.9w,0.9h} righthist]
Define the series of the main plot. The @series macro makes a local copy of the attribute dictionary d using a "let block". The copied dictionary and the returned args are added to the Vector{RecipeData} which is returned from the recipe. This block is similar to calling histogram2d!(x, y; subplot = 2, d...) (but you wouldn't actually want to do that).
Note: this @series block gets a "snapshot" of the attributes, so it contains anything that was set before this block, but nothing from after it. @series blocks can be standalone, as these are, or they can be in a loop.
    # main histogram2d
    @series begin
        seriestype := :histogram2d
        subplot := 2
        x, y
    end
Next we move on to the marginal plots. We first set attributes which are shared by both:
    # these are common to both marginal histograms... borrow the first color from the fill gradient
    fillcolor := getColor(colorscheme(get(d, :fillcolor, Plots.default_gradient())))
    fillalpha := 0.3
    linealpha := 0.3
    seriestype := :histogram
Now we create two more series, one for each histogram.
    # upper histogram
    @series begin
        subplot := 1
        x
    end

    # right histogram
    @series begin
        orientation := :h
        subplot := 3
        y
    end
end
It's important to note: normally we would return arguments from a recipe, and those arguments would be added to a RecipeData object and pushed onto our Vector{RecipeData}. However, when creating series using the @series macro, you have the option of returning nothing, which will bypass that last step.